An H - R Diagram depicting some of the major parts including the main sequence, white dwarfs, and red giants
Source: http://chandra.harvard.edu/edu/formal/variable_stars/HR_student.html
Source: http://chandra.harvard.edu/edu/formal/variable_stars/HR_student.html
Structure and Usage of Hertzsprung - Russell Diagrams
The Hertzsprung – Russell Diagram, or HR – Diagram is an astronomical plot used by astronomers to study and classify stars. Stars are plotted by their temperature and luminosity. These two properties are associated with the spectral class and absolute magnitude of the star, which are also shown. Based on a stars location on an HR – Diagram, one can learn about a stars age, lifecycle, and predict the future properties of the star via the Vogt – Russell Theorem.
Usually, an increase in vertical position corresponds to an increase in luminosity, and an increase in horizontal position to a decrease in temperature. This allows us to classify stars with similar properties into regions. For example, hot and dim stars known as white dwarfs are found in the bottom left hand corner, while cool, bright stars like red giants and red super giants are found in the top right corner. Most stars reside in the main sequence, which can be found going from the top, left corner to the bottom right corner of the HR – Diagram. All main sequence star are in thermo - gravitational equilibrium, and burn hydrogen using nuclear processes.
Since HR – Diagram have accumulated so much astronomical data, astronomers have observed certain trends. One of these is shown in the evolutionary track of an HR – Diagram. The evolutionary track shows the general movement of stars on an HR – Diagram as they evolve. Similarly, the birth line is a small region to the right of a main sequence, which contains stars being born. This is not a fixed region, and varies from star to star, just as the evolutionary track varies from star to star. It is important to note that a star's movement on a HR - Diagram is NOT a physical movement, but rather a change in the star's properties. A star that follows the evolutionary track varies luminosity and temperature over time, not in location over time.
Two of the more interesting regions are the instability strip, and the asymptotic giant branch. The instability strip is located above (almost perpendicular) to the main sequence, to the left of the red giants. It contains pulsating variable stars whose apparent magnitudes change over time. The apparent magnitude can change due to changes in the absolute magnitude, or in changes in the orbital path. These changes can be caused by internal, or external changes in the star. The absolute magnitude can vary in the battle between the thermodynamic and gravitational forces. This can cause the star to expand and contract, which varies the light output. The orbital path can also change, if another star blocks the path of light from the star to the Earth. The AGB contains large, bright stars of low mass. It is located asymptotically to the left of the red giants.

|
|
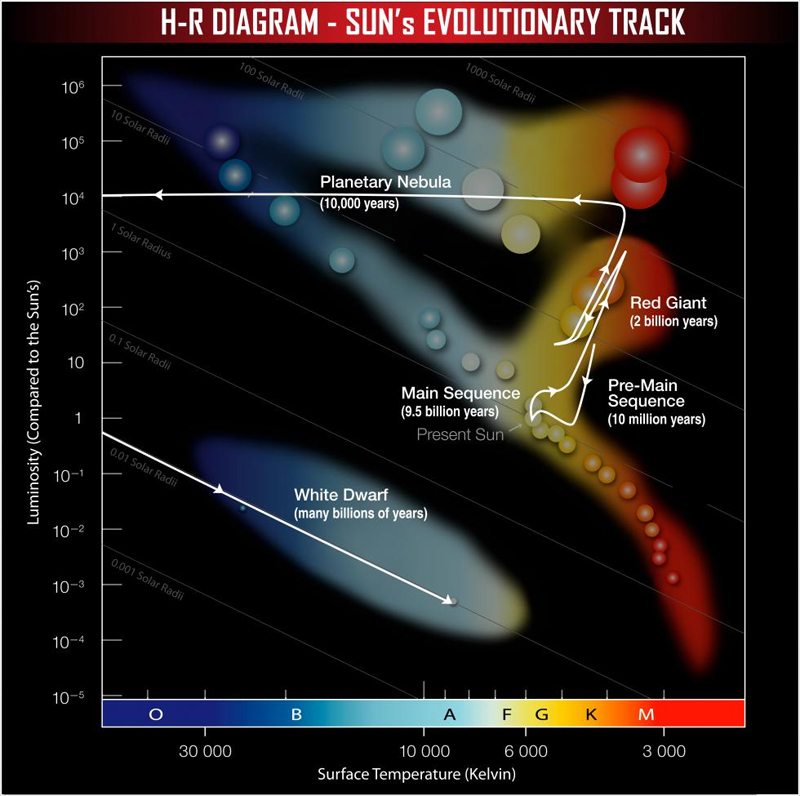
Two additional views of H - R Diagrams. The diagram on the left focuses on the various categories of stars and there relative locations, including white dwarfs, the sun, and red giants. The diagram on the left shows the evolutionary track for our sun as it changed from phase to phase.
Source: http://chandra.harvard.edu/edu/formal/variable_stars/HR_student.html
Source: http://chandra.harvard.edu/edu/formal/variable_stars/HR_student.html
Other Tools
Astronomers also use the Vogt - Russel Theorem to help determine the evolution of stars. The Vogt - Russel Theorem stats that stellar evolution is entirely determined by the initial chemical composition and mass. This means that if the star remains separated from all external influences, scientists can perfectly predict everything that happens to a star, if they know how it initially started. Tracing the evolutionary track of a star shows how in some ways the Vogt - Russel Theorem is helpful.
The Chandrasekhar Limit is another tool used by astronomers. It gives the maximum mass possible for a stable white dwarf, and is currently believed to be around 1.44 Solar Masses. It is used to predict whether or not a star will supernova.
The Chandrasekhar Limit is another tool used by astronomers. It gives the maximum mass possible for a stable white dwarf, and is currently believed to be around 1.44 Solar Masses. It is used to predict whether or not a star will supernova.
